

Optima AUC
A Beckman Coulter introduziu o primeiro instrumento de ultracentrífugação analítica para caracterização de amostras para ajudar a comunidade científica em suas descobertas. A tradição continua no século 21 com o sistema Optima™ AUC.
Esta nova ferramenta é a mais robusta tecnologia em providenciar dados utilizados para determinar o peso molecular proteico em uma pesquisa de proteína básica e quantificação dos níveis de agregação para pesquisa acadêmica e de biofármacos.
Quer aprender mais sobre Ultracentrifugação Analítica? Dê uma olhada mais aprofundada em nossa seção de Recursos de AUC.

Características
Qualidade de Dados Aprimorado
- Maior resolução radial
- Melhor relação de sinal / ruído se comparado ao ProteomeLab
- 11x mais píxeis verticais para ótica de interferência
- Permite análise precisa de sistemas complexos em comprimento de ondas discretos (até 20) em tempo mínimo
Analisa uma ampla variedade de partículas em estado nativo, livre de matrizes, incluindo:
- Proteínas
- Nanopartículas
- Peptídeos
- Polímeros
- Micelas
- Lipossomas
- Vesículas extracelulares
- Conjugados de medicamentos
- Carga viral
Fornece dados que podem responder perguntas mais críticas se comparada a outras técnicas, incluindo:
- Formato
- Massa
- Diâmetro
- Estequiometria
- Heterogeneidade
- Associação
- Agregação
- Pureza
- Formulação
Fácil Uso
- Tela touchscreen de fácil uso indica progressão intuitiva de design experimental
- Capacidade de monitoramento remoto possibilita que você dê um passo adiante, monitore e extraia dados virtualmente de qualquer localização
- Compatibilidade com as células e rotores do ProteomeLab XL
- Alternação ótica acelera a preparação do fluxo de trabalho
Explore Optima AUC Models
Partes Relacionadas

A-100/18 Fixed-Angle Rotor, 6 x 175 µL, 95,000 rpm, 149,000 x g
A-100/18 Rotor is a fixed-angle rotor for use in Beckman Coulter Airfuge Air-Driven Micro-Ultracentrifuges, made of aluminum and anodized silver. Major applications: Fast pelleting of very small samples.

A-95 Fixed-Angle Rotor, 4 x 450 µL, 95,000 rpm, 178,000 x g
The A-95 Rotor is a fixed-angle rotor for use in Beckman Coulter Airfuge Air-Driven Micro-Ultracentrifuges. Major applications: Fast pelleting of very small samples.

A-100/30 Fixed-Angle Rotor, 6 x 240 µL, 92,000 rpm, 167,000 x g
A-100/30 Rotor is a fixed-angle rotor for use in Beckman Coulter Airfuge Air-Driven Micro-Ultracentrifuges. Major applications: Fast pelleting of very small samples.

ACR-90 Chylomicron Rotor, 3.5 mL, 90,000 rpm, 122,000 x g
The ACR-90 Chylomicron Rotor is a specialty rotor for use in Beckman Coulter Airfuge Air-Driven Micro-Ultracentrifuges. Major applications: Rapid clarification of lipemic blood samples. Consists of a supporting base, a disposable polyethylene liner, a stainless steel lid, adapters for 2.4 mL liners, and rotor stand/vise.

Aluminum Batch Rotor 7 mL, 90,000 rpm, 132,000 x g
Batch rotor, aluminum, for 2 mL to 7 mL volumes. For use in Beckman Coulter Airfuge Air-Driven Micro-Ultracentrifuges. Sample is placed in the rotor body istelf or in one of two types of polyethylene liners. A plastic window disk is placed between the rotor and the lid to contain samples during centrifugation. Major applications: Rapid processing of fruit paste. Includes rotor stand/vise, o-ring, and bushing.

EM-90 Electron Microscopy Rotor
EM-90 Electron Microscopy Particle Counting Rotor, Silver Major applications: Sedimenting particles onto filter membranes, glass cover slides, and micropscope grids. For use in Airfuge; Air-Driven Micro-Ultracentrifuges. Includes: 5 mm Sector Core with 600; L capacity (100L per cell) (Part Number 347836), 3 mm Sector Core with 360; L capacity (60; L per cell) (Part Number 347838) Rotor Stand/Vise (Part Number 341252) Rotor Gaskets (Part Number 347840) Sector Core Removal Bolt Template; O-Ring (Part Number 853156) Bushing (Part Number 343197)


Documentos técnicos
FAQ on the Optima AUC Analytical Ultracentrifuge
How do you analyze AUC data?
AUC data can be exported and analyzed using several different software packages including SEDFIT, UltraScan, SedAnal, SedPHAT, and more*.
Beckman Coulter Life Sciences released the Optima AUC cGMP Suite software, which helps with experimental setup, live data monitoring, analysis and report generation, while supporting 21 CFR Part 11 compliance.
*Third-party analysis software has not been validated by Beckman for use with the Analytical Ultracentrifuge. Beckman does not endorse any third-party analyses software. Beckman warranty and/or performance guarantee that may be applicable or are provided by Beckman for Analytical Ultracentrifuge do not apply to any third-party software.How is fringe displacement calculated?
The system performs a single-point discrete Fourier transform (DFT) at the frequency represented by the fringe vertical frequency. This transform is calculated on each vertical column of data, across the entire row. The phase of each calculation is used to calculate fringe displacement (1 fringe displacement = 360 degrees of phase shift).
How is the sedimentation coefficient determined?
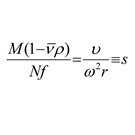
If you know the particle velocity (υ), the angular velocity (ω), and the radius from the axis of rotation (r), you can calculate the sedimentation coefficient (s).
Per the left side of the equation, this value is proportional to molecular weight (M) multiplied by buoyancy factor (1-v p and inversely proportional to the frictional coefficient. Large values of S (faster sedimentation rate) correspond to larger molecular weight.
What do fringe patterns from interference testing reveal?
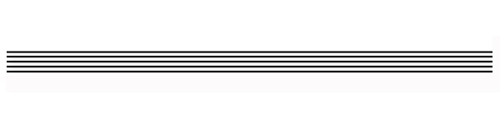
If the two beams pass through identical substances, the resulting fringe pattern is relatively constant across the length of the image, as shown here:
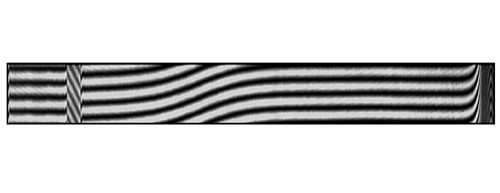
If the beams pass through different substances, and the concentration of one of them varies across the radial length, the fringe pattern shows interference as seen here:
How is sample detection done in an analytical ultracentrifuge (AUC)?
Two common types of optical analysis include UV/visible light absorbance (detecting wavelengths between 190 and 800 nm) and Rayleigh interference. Both rely on light passing through the sample, with a detector capturing the light after it passes through the sample. Data is collected in this manner over the course of the centrifugation, so that the sedimentation pattern of the sample can be tracked. Various calculations are made from the data to determine sample characteristics.
Do Optima AUC rotors differ from those for a preparative centrifuge?
Yes. AUC rotors are designed to address additional considerations, such as:
-
Light passage
AUC rotors are designed so light can pass through a sample, generally from top to bottom. -
Overspeed disk
To prevent damage, the overspeed disk allows the system to determine the maximum rated speed of the rotor and prevent it from spinning faster than that maximum. -
Timing magnet
This is embedded in the overspeed disk. A pickup device in the system senses when the magnet passes over and generates a pulse that represents a known time. The AUC uses this pulse to synchronize the rotor speed with the flash of the light source.
How is an analytical ultracentrifuge (AUC) counterbalance configured?
An AUC counterbalance not only offsets sample cell weight, but also provides a way to calibrate the optics.
Each counterbalance, which is always anodized red, features four reference holes with removable mask windows.
The inner edges of the reference holes should match the outer edges of the centerpiece cell. The counterbalance weight can be adjusted by screwing weights into the center of the counterbalance cell. Using the provided screw weights, the counterbalance must weigh within 0.5 grams of the sample directly opposing it in the rotor.
What is interference and how is it detected using analytical ultracentrifugation (AUC)?
There are two types of interference:
-
Constructive Interference
When crests/troughs of two waves meet, creating a crest/trough equal to the sum of their amplitudes. -
Destructive Interference
When the crest of one wave meets the trough of another, cancelling each other out. -
Constructive and Destructive Pattern from 2 Slits
If a light source is passed through two parallel slits, it creates constructive and destructive interference in a repeating "fringe" pattern that can be analyzed via AUC. The interference optical system, in the Optima AUC Analytical Ultracentrifuge, performs scans in which fringe displacement is measured as a function of radial distance.
