Miniaturized 16S rRNA Amplicon Sequencing with the Echo 525 Liquid Handler for Metagenomic and Microbiome Studies
Introduction
Our understanding of the microbial communities in human health, metagenomics, and metataxonomics has been growing rapidly in recent years and is being increasingly elucidated every day. Amplicon sequencing of highly conserved prokaryotic 16S ribosomal RNA (rRNA) regions has long been the standard technique used to assess the diversity and phylogenetic classification of these communities. While advances in next-generation sequencing are enabling routine whole-genome shotgun sequencing in microbial communities, 16S rRNA amplicon sequencing is still frequently used for quick diagnosis of samples. Here, we perform a standard Illumina 16S rRNA amplicon sequencing library preparation at miniaturized scale using the Echo 525 Liquid Handler, effectively reducing reaction volumes and input sample while maintaining sufficient read depth to accurately capture the community. The result is a significantly cost-reduced workflow per sample, saving reagent costs, operational time costs, and valuable sample DNA.
Overview
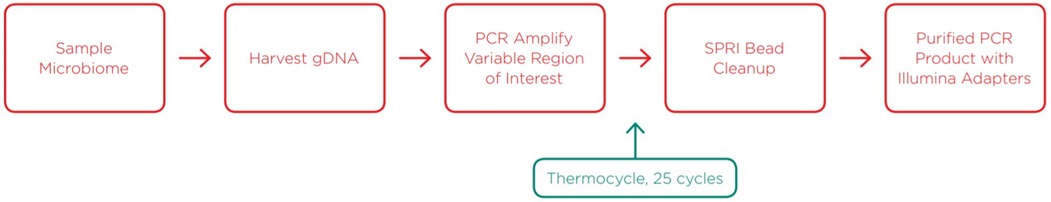
Amplifying Sample Region of Interest and Adding Illumina Adapters
Attaching Nextera XT Indices to Samples via Amplification from Adapters
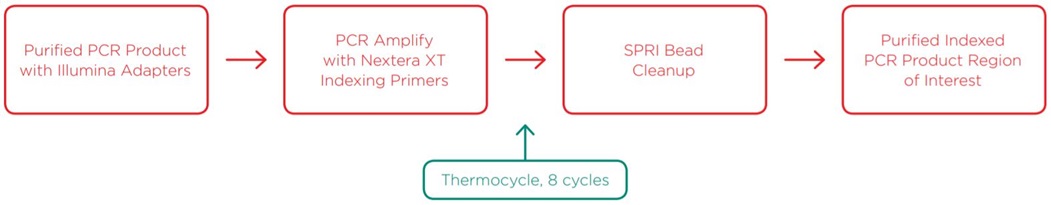
After generating purified PCR product of the region of interest with Illumina adapters attached, we added Nextera XT indices for a paired-end sequencing strategy via a second, reduced-cycle PCR amplification. Indexing primers were sourced from Integrated DNA Technologies (IDT) and delivered directly in Echo-compatible 384-well source plates. By utilizing the Echo 525 Liquid Handler, we reduced the reaction to 5µL, which again enabled a reduced volume SPRI bead cleanup. Details of this method are described in the methods section.
Library QC, Generating and Analyzing Data
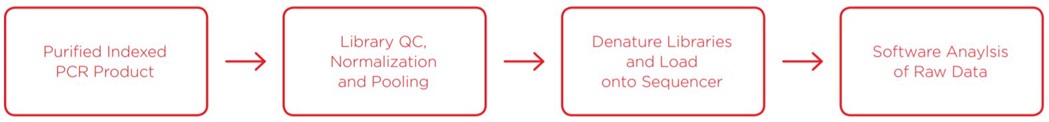
Once the purified indexed PCR product is obtained, library QC is performed. We ran a reduced-volume Picogreen assay for quantitation, and fragment size analysis via Agilent TapeStation, both enabled with the Echo 525 Liquid Handler. Libraries were then rapidly pooled and normalized in one step using the Echo 525 Liquid Handler, then denatured and diluted down to 10pM final concentration. Because of the highly conserved nature of 16S rRNA amplicons when surveying one region, the library is very low diversity, which causes difficulty in loading Illumina sequencers to specified maximums. We loaded a MiSeq v3 600-cycle kit to 10pM, with 10% PhiX control, to generate high quality data. Analysis of the data was run through two software programs: Illumina 16S Metagenomics in BaseSpace, and the CosmosID rapid identification pipeline.
Method
Sample input DNA tested: 2.5 ng, 1 ng, 0.5 ng
Technical replicates: Quadruplicate
| First PCR | Protocol (µL/rxn) | Miniaturized 2.5 ng | Miniaturized 1 ng | Miniaturized 0.5 ng | Echo Calibration |
| Input Sample DNA (5 ng / µL) | 2.5 | 0.5 | 0.2 | 0.1 | 384PP_AQ_BP |
| Variable Region Forward Primer | 5 (1 µM) | 0.05 (100 μM) | 0.05 (100 μM) | 0.05 (100 μM) | 384PP_AQ_BP |
| Variable Region Reverse Primer | 5 (1 μM) | 0.05 (100 μM) | 0.05 (100 μM) | 0.05 (100 μM) | 384PP_AQ_BP |
| 2x KAPA HiFi HotStart ReadyMix | 12.5 | 2.5 | 2.5 | 2.5 | 384PP_AQ_GPSa |
| Water | 0 | 1.9 | 2.2 | 2.3 | 384PP_AQ_BP |
| Total volume | 25 | 5 | 5 | 5 |
Spin @ 1500g, 30 seconds
| PCR Reaction | |
| 95°C | 3 min |
| 95°C | 30 sec |
| 55°C | 30 sec |
| 72°C | 30 sec |
| 72°C | 5 min |
| 4°C | forever |
| First SPRI Bead Cleanup | Protocol (µL/rxn) | Miniaturized 2.5 ng | Miniaturized 1 ng | Miniaturized 0.5 ng |
| First PCR Reaction | 25 | 5 | 5 | 5 |
| AmpureXP Magnetic Beads 2 | 20 | 8 | 8 | 8 |
| Total volume | 45 | 13 | 13 | 13 |
First SPRI Bead Cleanup:
- Gently pipette entire volume up and down 10 times. Incubate at room temperature without shaking for 5 minutes.
- Place on magnet plate for 2 minutes or until solution clarifies.
- While still on magnet plate, use a multichannel pipette to remove and discard 11 µL supernant.
- Using a multichannel pipette, add 30 µL of 80% ethanol to each well. Incubate 30 seconds.
- Using a multichannel pipette, remove all ethanol. Repeat the ethanol wash a second time.
- While still on magnet plate, allow drying for 5 minutes.
- Remove sample plate from magnet plate. Add 20 µL ddH2O, carefully mixing beads into solution. Incubate at room temperature for 2 minutes, no shaking
- Place sample plate on magnet plate, allowing solution to clarify.
- Using a multichannel pipette, remove 15 µL of solution to a fresh sample collection plate (Echo Qualified 384 LDV Plus Microplate).
| Second PCR | Protocol (µL/rxn) | Miniaturized 2.5 ng | Miniaturized 1 ng | Miniaturized 0.5 ng | Echo Calibration |
| Cleaned Sample from First PCR | 5 | 2.4 | 2.4 | 2.4 | 384PP_AQ_BP |
| Variable Region Forward Primer | 5 (1 μM) | 0.05 (100 μM) | 0.05 (100 μM) | 0.05 (100 μM) | 384PP_AQ_BP |
| Variable Region Reverse Primer 5 | 5 (1 μM) | 0.05 (100 μM) | 0.05 (100 μM) | 0.05 (100 μM) | 384PP_AQ_BP |
| 2x KAPA HiFi HotStart ReadyMix | 25 | 2.5 | 2.5 | 2.5 | 384PP_AQ_GPSa |
| Water | 10 | 0 | 0 | 0 | 384PP_AQ_BP |
| Total volume | 50 | 5 | 5 | 5 |
Spin @ 1500g, 30 seconds
| PCR Reaction | |
| 95°C | 3 min |
| 95°C | 30 sec |
| 55°C | 30 sec |
| 72°C | 30 sec |
| 72°C | 5 min |
| 4°C | forever |
| Second SPRI Bead Cleanup | Protocol (µL/rxn) | Miniaturized 2.5 ng | Miniaturized 1 ng | Miniaturized 0.5 ng |
| Second PCR Reaction | 50 | 5 | 5 | 5 |
| AmpureXP Magnetic Beads | 56 | 8 | 8 | 8 |
| Total volume | 106 | 13 | 13 | 13 |
Second SPRI Bead Cleanup:
- Gently pipette entire volume up and down 10 times. Incubate at room temperature without shaking for 5 minutes.
- Place on magnet plate for 2 minutes or until solution clarifies.
- While still on magnet plate, use a multichannel pipette to remove and discard 11 µL supernant.
- Using a multichannel pipette, add 30 µL of 80% ethanol to each well. Incubate 30 seconds.
- Using a multichannel pipette, remove all ethanol. Repeat the ethanol wash a second time.
- While still on magnet plate, allow drying for 5 minutes.
- Remove sample plate from magnet plate. Add 20 µL ddH2O, carefully mixing beads into solution. Incubate at room temperature for 2 minutes, no shaking.
- Place sample plate on magnet plate, allowing solution to clarify.
- Using a multichannel pipette, remove 15 µL of solution to a fresh sample collection plate (Echo Qualified 384 LDV Plus Microplate).
SPRI bead cleanup after each PCR is essential to minimize any interference and unwanted products with the subsequent PCR and sequencing steps. SPRI bead cleanup followed the Agencourt AmpureXP PCR purification protocol for 384-well format. We utilized 8µL of beads for our 5µL amplification reaction, and eluted in 20μL. SPRI bead cleanup is an expensive component of the process, and we dramatically reduce the usage of beads per reaction.
Depending on the efficiency of the SPRI bead cleanup, the number of cycles in the second PCR step can be increased. As the user implements the process, the balance between increasing cycles to generate more product must be balanced with potential amplification biases, and this point varies amongst sample and GC composition.
Library quantitation was performed to verify libraries and to normalize input into the sequencing process. The Picogreen fluorescence-based quantitation assay was used to determine the concentration of amplicon products. The Picogreen protocol was performed according to the ThermoFisher standard protocol, but volumes were miniaturized 1/100 from 2mL to 20μL in a Greiner 384-well clear-bottom plate. The Echo 525 Liquid Handler was used to dispense amplicon samples and Picogreen reagents into the Greiner 384-well plate. Results were read on the BMG Pherastar spectrophotometer. Fragment size analysis was also performed to validate that our amplicons are produced at the expected 450bp size. The Echo 525 Liquid Handler was able to transfer samples and reagents into the assay plate, and results were read using the Agilent TapeStation 2200.
Using the concentration data from the Picogreen assay, we built a normalization worklist in Excel to obtain equimolar pooling of samples. Normalization can be accomplished simultaneously during pooling using the Echo 525 Liquid Handler and a worklist, in minutes. Normalization is a function of the desired number of reads allotted to each sample. For our purposes, we seek even distribution of reads to all samples. In general, >100,000 reads per sample is considered sufficient to fully survey the metagenomic sample. When using an Illumina MiSeq, theoretical maximums for multiplexing is about 96 samples. This number can increase if less reads per sample are needed to reach saturation
Knowing that our amplicon is 450bp using the primers described in this process, we aimed to normalize and pool our library to 4nM. Because of the highly conserved nature of 16S rRNA amplicons when surveying the same region across a multiplex of samples, the library is very low diversity, and that causes difficulty in loading Illumina sequencers to specified maximums. We loaded a MiSeq v3 600-cycle kit to 10pM, with 10% PhiX control, to generate sufficient diversity and resolution for high quality data. Analysis of the data was run through two software programs: Illumina 16S Metagenomics in BaseSpace, and the CosmosID rapid identification pipeline.
Results and Discussion
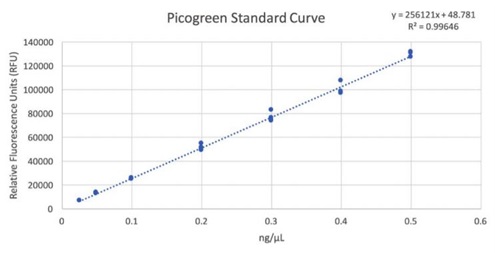
Figure 1: Picogreen standard curve generated by using the Echo 525 Liquid Handler. The instrument is able to perform accurate and precise transfers of the lambda DNA used in this standard curve by direct dilution, avoiding propagation of errors in serial dilution.
| Picogreen Quantitation Data - RFUs converted to [DNA] | ||||||||||
| ng/µL | 1 | 2 | 3 | 4 | 5 | 6 | 7 | 8 | 9 | 10 |
| A | 19.2 | 17.9 | 18 | 18.1 | 18 | 17 | 20.5 | 20.1 | 20.1 | 19.8 |
| B | 19.5 | 20.6 | 17.8 | 17.6 | 18.1 | 17.2 | 18.1 | 17 | 20.2 | 20.1 |
| C | 19.6 | 20.1 | 21 | 20.2 | 17.4 | 17.9 | 17.4 | 17.4 | 17.6 | 16.1 |
| D | 19.4 | 18.8 | 18 | 19.3 | 18.9 | 18.9 | 17.2 | 17.3 | 19 | 17.5 |
| E | 17.3 | 16.3 | 19.2 | 16.9 | 18.3 | 19.6 | 20.5 | 20.1 | ||
Table 1:: An overview of the sample quantities, converted from relative fluorescence units (RFUs) to concentration (ng/µL) based on the standard curve. Using the standard curve equation, we solved for concentration: [DNA] = (RFU-48.781)/256121.
Zymobiomics Community Panel
|
ATCC Community Panel
|
Saccharomyces cerevisiae (Negative Control)
|
Staphylococcus aureus (Positive Control)
|
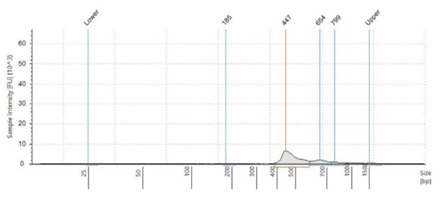
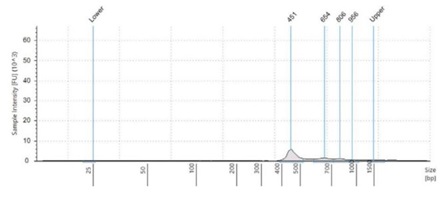
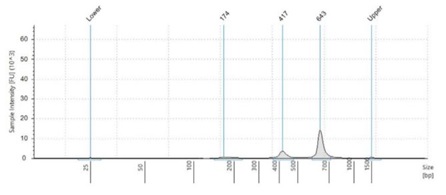
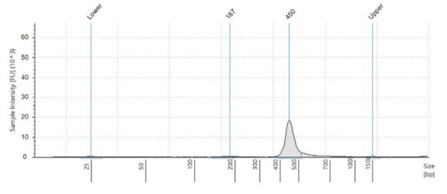
Figure 2:Fragment size analysis electropherograms of a few representative samples.
After both PCR steps and subsequent SPRI bead cleanups, we processed each amplicon library through library quantitation and fragment size analysis as described in the methods. We found that with the described amount of thermocycling and bead cleanup parameters, our final libraries resulted in an average concentration of 18.5 ng/μL, with a CV of 6.9%. This should be sufficient to make a 4nM library pool. Furthermore, by using fragment size analysis, we confirmed the presence of our expected 450bp amplicon in the Zymo and ATCC panel, as well as our positive control, S. aureus. While in our negative control, S. cerevisiae, this amplicon is missing. Interestingly, the negative control amplifies a 650bp band, which we believe is non-specific binding and amplification of some homologous region. Furthermore, we see a small peak of this approximate size in the ATCC and Zymo community samples, which both contain a few fungal microbes. To reduce this non-specific amplicon, the annealing point of our PCR protocol can be increased. This non-specific 650bp amplicon in fungal samples is also responsible for the yield in the Picogreen quantitation assay of our negative control samples.
After sequencing on an Illumina MiSeq using v3 2x300 chemistry, we sought the index distribution. The Echo 525 Liquid Handler normalized the samples to achieve near-equivalent read distribution. It is important to note that the negative controls were also normalized, pooled, and run in the MiSeq. While these samples yielded similar concentration from the non-specific amplicon, the majority did not amplify with indices correctly, and thus these negative samples show low read representation. We do not recommend running negative controls through sequencing. For most purposes, it is not worth the indices and reads used.
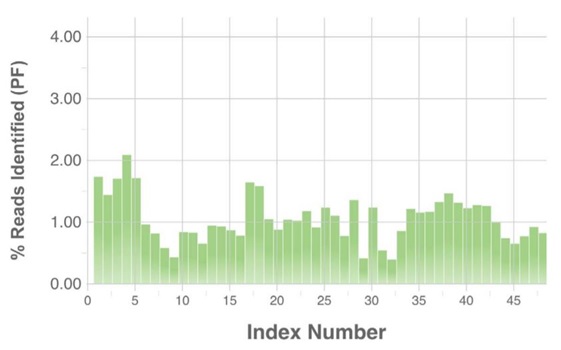
Figure 3:Index distribution of 16S rRNA amplicon samples from Illumina BaseSpace.
| Source | Reference | Sample gDNA Abundance (%) | |||
| Organism | gDNA | 2.5 ng input | 1 ng input | 0.5 ng input |
|
| ZymoBiomics D6305 | Pseudomonas aeruginosa | 12 | 7.50 | 7.28 | 6.95 |
| ZymoBiomics D6305 | Escherichia coli | 12 | 2.10 | 2.05 | 2.01 |
| ZymoBiomics D6305 | Salmonella enterica | 12 | 1.60 | 1.56 | 1.52 |
| ZymoBiomics D6305 | Lactobacillus fermentum | 12 | 18.70 | 18.41 | 17.94 |
| ZymoBiomics D6305 | Enterococcus faecalis | 12 | 7.00 | 7.20 | 7.60 |
| ZymoBiomics D6305 | Staphylococcus aureus | 12 | 15.50 | 15.19 | 15.50 |
| ZymoBiomics D6305 | Listeria monocytogenes | 12 | 11.60 | 11.78 | 12.32 |
| ZymoBiomics D6305 | Bacillus subtilis | 12 | 18.20 | 18.64 | 19.25 |
| ZymoBiomics D6305 | Saccharomyces cerevisiae | 2 | 0 | 0 | 0 |
| ZymoBiomics D6305 | Cryptococcus neoformans | 2 | 0 | 0 | 0 |
| ZymoBiomics D6305 | Total Reads | 382,386 | 360,318 | 341,417 | |
| ATCC MSA-1002 | Acinetobacter baumannii | 5 | 8.74 | 8.65 | 8.34 |
| ATCC MSA-1002 | Actinomyces odontolyticus | 5 | 1.93 | 1.90 | 1.90 |
| ATCC MSA-1002 | Bacillus cereus | 5 | 2.50 | 2.57 | 2.84 |
| ATCC MSA-1002 | Bacteroides vulgatus | 5 | 10.27 | 9.94 | 9.32 |
| ATCC MSA-1002 | Bifidobacterium adolescentis | 5 | 4.30 | 4.32 | 4.31 |
| ATCC MSA-1002 | Clostridium beijerinckii | 5 | 9.51 | 9.61 | 10.05 |
| ATCC MSA-1002 | Deinococcus radiodurans | 5 | 4.89 | 4.59 | 4.41 |
| ATCC MSA-1002 | Enterococcus faecalis | 5 | 1.94 | 2.07 | 2.21 |
| ATCC MSA-1002 | Escherichia coli | 5 | 1.31 | 1.29 | 1.35 |
| ATCC MSA-1002 | Helicobacter pylori | 5 | 3.36 | 3.33 | 3.11 |
| ATCC MSA-1002 | Lactobacillus gasseri | 5 | 6.89 | 6.88 | 6.98 |
| ATCC MSA-1002 | Neisseria meningitidis | 5 | 6.18 | 6.12 | 5.95 |
| ATCC MSA-1002 | Porphyromonas gingivalis | 5 | 5.83 | 5.79 | 5.43 |
| ATCC MSA-1002 | Propionibacterium acnes | 5 | 3.02 | 3.16 | 3.02 |
| ATCC MSA-1002 | Pseudomonas aeruginosa | 5 | 1.99 | 2.01 | 2.15 |
| ATCC MSA-1002 | Rhodobacter sphaeroides | 5 | 0.63 | 0.60 | 0.65 |
| ATCC MSA-1002 | Staphylococcus aureus and epidermidis | 10 | 8.85 | 8.92 | 9.22 |
| ATCC MSA-1002 | Streptococcus agalactiae and mutans | 10 | 9.16 | 9.37 | 9.58 |
| ATCC MSA-1002 | Total Reads | 425,237 | 387,027 | 382,791 | |
| Positive Control | Staphylococcus aureus | 100 | 94.55 | 95.36 | 94.71 |
| Total Reads | 305,673 | 313,864 | 258,883 | ||
| Negative Control | Saccharomyces cerevisiae | 100 | 0 | 0 | 0 |
| Bacterial | 0 | 3.08 | 3.10 | 2.99 | |
| Total Reads | 9,066 | 6,988 | 7,251 | ||
Table 2: MiSeq 16S rRNA amplicon sequencing data post-analysis from Illumina BaseSpace App “16S Metagenomics.” Identification was based on genus-level filtering. Species data was highly inaccurate, and would require variable region optimization in repeated runs. Negative control (fungal) yielded very little reads aligning, indicating our 16S rRNA amplicon primers are not adhering to fungal species at a significant level. Positive control (bacterial) yielded strong total read alignment to the reference, indicating our 16S rRNA amplicon primers are strongly binding the intended region.
We then ran our raw data through the Illumina BaseSpace app, 16S Metagenomics. We aggregated the data based on genus-level filtering. Species data was inaccurate; the application was calling many species that simply did not exist in the sample community. Multiple variable regions must be surveyed and the data orthogonally compared to obtain accurate species data. In the table, we see that reducing the sample input DNA did not affect analysis or read count; these percentages were consistent across the input amounts. We also see underrepresentation and overrepresentation of some genera. This highlights the inaccuracy of surveying just one variable region, as well as potential analysis shortcomings and GC amplification bias. The positive control showed 95% alignment of reads to the correct organism, indicating that our 16S rRNA V4 amplicon primers are strongly binding the intended region and reads are identifying the correct organism. The negative control showed that only a small fraction of the reads were aligning, indicating that we have minimal binding of our primers to fungal species.
Sample Key for CosmosID
| SAMPLE NUMBER | 2.5, 1, 0.5 ng Input | 2.5, 1, 0.5 ng Input | 2.5, 1, 0.5 ng Input | 2.5, 1, 0.5 ng Input |
| Replicate 1 | Replicate 2 | Replicate 3 | Replicate 4 | |
| Zymo Microbial Community | 1, 2, 3 | 13, 14, 15 | 25, 26, 27 | 37, 38, 39 |
| ATCC Microbial Community | 4, 5, 6 | 16, 17, 18 | 28, 29, 30 | 40, 41, 42 |
| Positive Control (S. aureus) | 7, 8, 9 | 19, 20, 21 | 31, 32, 33 | 43, 44, 45 |
| Negative Control (S. cerevisiae) | 10, 11, 12 | 22, 23, 24 | 34, 35, 36 | 46, 47, 48 |
Table 3: This table corresponds the sample number to the description of the sample.
Alpha Diversity Measurements
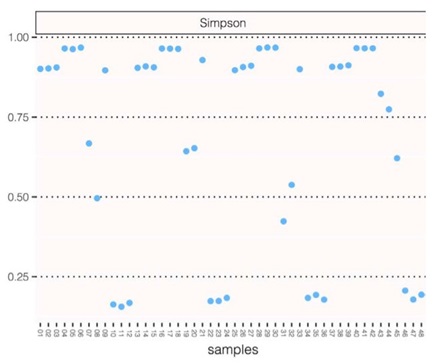
Figure 4: CosmosID Simpson method of alpha diversity measurements. The triplet pattern shows that despite lowering the input DNA amount of a given sample, we are not losing any diversity.
Rarefaction Curves
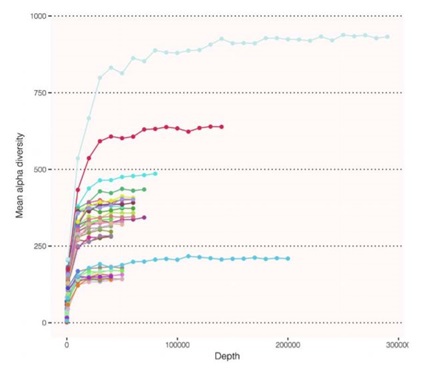
Figure 5: CosmosID Chao method for representing rarefaction curves. The asymptote shows the number of reads to saturate the microbiome. That is, no more reads are needed to capture diversity. In our less complex samples, we are able to saturate diversity below 100,000 reads.
Genus Level
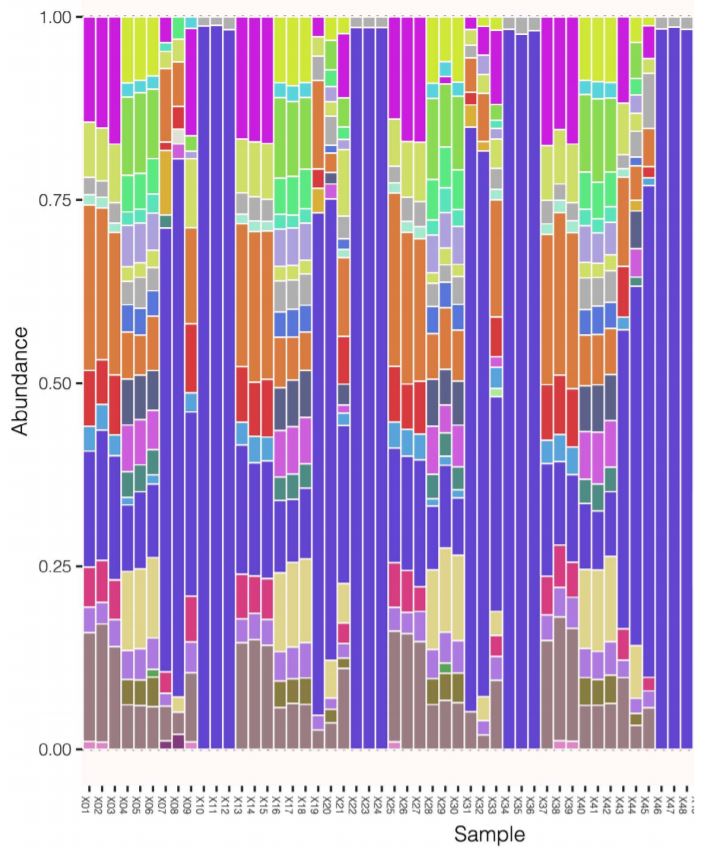
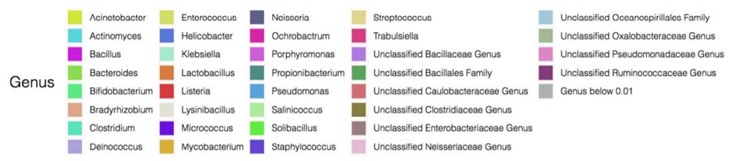
Figure 6: CosmosID stacked bar chart representing genus distribution. The triplet pattern reinforces consistent answers across decreasing input DNA. We also expect to see even distribution of genera as given in the microbial community references.
Network Graph: Based on Bray-Curtis Distance
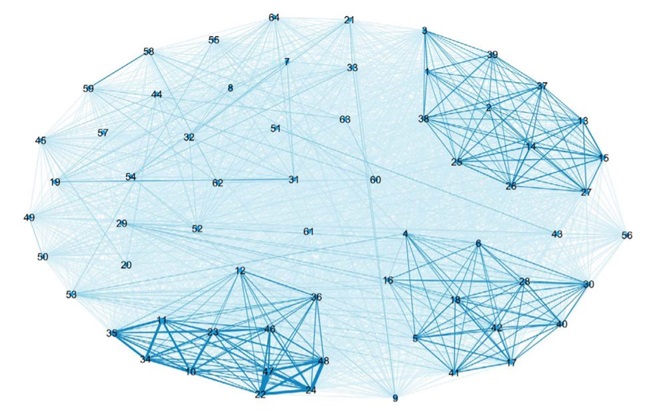
Figure 7: CosmosID Network graph, based on Bray-Curtis distance. We see that the analysis is able to strongly link the replicates together, as well as same samples with decreasing input DNA.
We collaborated with CosmosID and they returned a wealth of information following their analysis of our raw 16S rRNA amplicon data. Both Illumina and CosmosID analyses show that decreasing the input DNA did not affect the results. CosmosID was able to rapidly identify and bin our samples by genus, but the analysis could not provide accurate species calls without more variable region data. CosmosID was also able to supply us with a rarefaction curve, helping us to determine for the next set of experiments, how many reads we will need to allocate per sample to saturate diversity.
Conclusion
As scientists continue to push our understanding of the role that microbiomes play in human health, metagenomics, and various other applications, the need increases for an even more rapid and costeffective 16S rRNA technique. We aimed to determine the optimal parameters for producing sufficient amounts of sequencing data at a volumetrically-reduced process, saving valuable input DNA and costly reagents.
We found that this miniaturized process produced plenty of amplicon library for downstream sequencing. Furthermore, decreasing the sample input DNA did not influence our results and analyses, all conclusions stayed consistent despite reducing the input by 5-fold. We do recognize that more complex microbial communities may require more thermocycling, more variable regions, or more input DNA, but these are all factors that must be considered and balanced for the most effective implementation. An alpha diversity curve plotted against reads is very useful in determining the amount of sequencing reads needed to saturate the community diversity, and is recommended for novel community studies and experimental design.
Materials
| Equipment | Manufacturer |
| Echo 525 Liquid Handler | Beckman Coulter Life Sciences |
| Allegra X-14 Centrifuge | Beckman Coulter Life Sciences |
| MixMate | Eppendorf |
| Qubit | Thermo Fisher |
| TapeStation 2200 | Agilent |
| BMG PHERAstar | BMG Labtech |
| ProFlex PCR System | Thermo Fisher |
| 384-well Post Magnet Plate | Alpaqua |
| MiSeq | Illumina |
| Reagents | Manufacturer | Part Number |
| Nextera XT Index Kit v2 Set A | Illumina | #FC-131-2001 |
| PhiX Control v3 | Illumina | #FC-110-3001 |
| KAPA HiFi HotStart ReadyMix (2X) | KAPA Biosystems | #KK2602 |
| 16S rRNA V4 Region Primers | Integrated DNA Technologies | Custom Oligos |
| TapeStation D1000 HS Kit | Agilent | #5067-5584, #5067-5585 |
| Qubit dsDNA HS Assay Kit | Thermo Fisher | #Q32851 |
| Quant-iT Picogreen dsDNA Assay Kit | Thermo Fisher | #P11496 |
| Agencourt AMPure Beads | Beckman Coulter Life Sciences | #A63881 |
| 200 Proof Ethanol | Sigma Aldrich | #E7023 |
| MiSeq Reagent Kit v3 (600-cycle) | Illumina | #MS-102-3003 |
| ZymoBiomics Microbial Community Standard | Zymo Research | D6305 |
| ATCC 20-strain Microbial Community Standard | ATCC | MSA-1002 |
| Staphylococcus aureus subsp. aureus gDNA | ATCC | 25923D-5 |
| Saccharomyces cerevisiae S288C gDNA | ATCC | 204508D-5 |
| Consumables | Manufacturer | Part Number |
| Echo Qualified 384-well PP Microplate | Beckman Coulter Life Sciences | 001-14555 |
| Echo Qualified 384-well LDV Plus Microplate | Beckman Coulter Life Sciences | 001-12782 |
| TapeStation Plate | Agilent | #5067-5150 |
| Qubit Microtube | Thermo Fisher | #Q32856 |
| 384-well PCR Plate | Bio-Rad | #HSP3805 |
| 384-well Black Flat Clear-Bottom Microplate | Greiner | #781096 |
| 1.5 mL DNA LoBind Tubes | Eppendorf | #022431021 |
