Flow Cytometric Approach to Probiotic Cell Counting and Analysis
Data provided by Dharlene Tundo, Department of Quality Control, VitaQuest International
IN THIS PAPER YOU WILL |
||
| Compare and contrast culture-based and flow cytometry based workflows for probiotic cell enumeration | Learn how to set up the flow cytometer for optimal detection of bacterial strains. | See a detailed staining protocol and gating strategy for enumerating live versus dead probiotic cells. |
Introduction
Probiotics were historically defined as substances secreted by one microorganism that promote the growth of another. The history of probiotics goes parallel with the evolution of the human race and can be traced back to the ancient times, nearly 10,000 years ago (1). Extensive research in recent years has exploded our understanding of the 100 trillion gut resident microbial cells contribute to health and disease (2). Indeed, industries devoted to leveraging beneficial organisms to restore balance to the gut microbiota have developed and continue to flourish.
One manufacturer is VitaQuest International, one of the largest custom contract manufacturers of nutritional supplements in the United States. They produce a range of probiotic containing supplements manufactured at large scale. Over twenty different bacterial strains from within the Lactobacillus and Bifidobacterium species, are handled in the formulation of different products. The complexity of the manufacturing process along with increased demand, and strict criteria for quality, potency, and safety in accordance to FDA regulations necessitates that manufacturers continue to improve production processes that increase productivity and efficiency.
A key method used to ensure product quality is the enumeration of probiotic organisms contained in the product. The traditional method is the Plate Count Method, a culture-based method for ascertaining the number of viable organisms in a sample, see figure 1. This method is laborious, requires specialized equipment for anaerobic incubation, and requires multiple days to develop the results. These characteristics of this assay limit its utility for real time decision making in a large scale production environment.
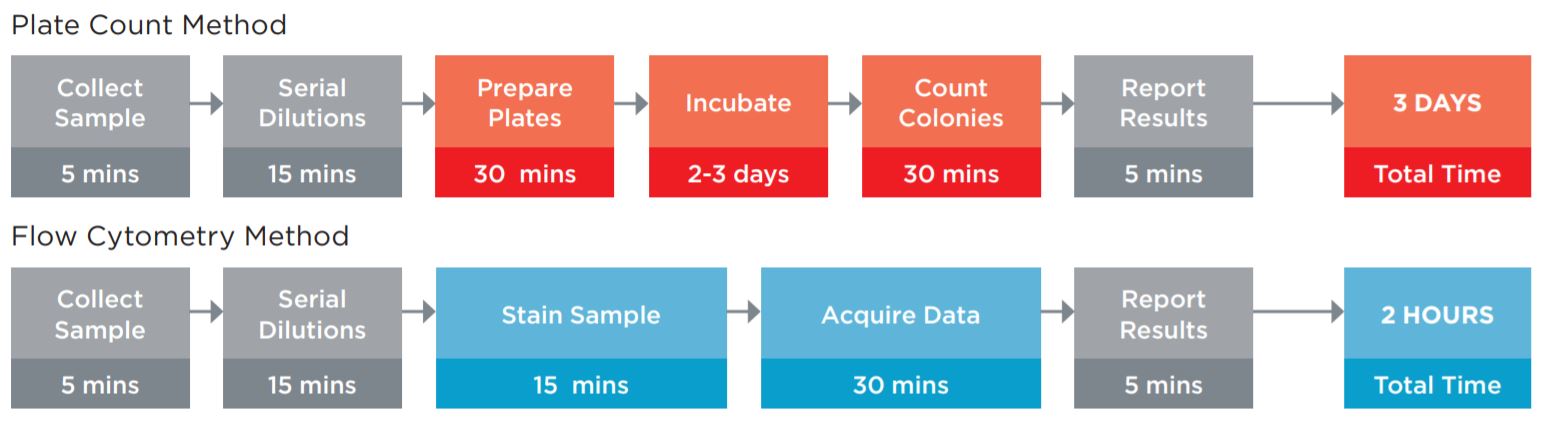
Figure 1. Comparison of the typical workflow for the Plate Count enumeration versus Flow Cytometric analysis. The plate counting method requires more direct time, but also requires the technician to maintain sterile media and plates for the assay. Using flow cytometry, not only are these obsolete, but data on the amount of live and dead organisms in the sample can be fridobtained, allowing the manufacturing process to be optimized. The assay time of 2 hours versus 3 days also allows for in line process improvements to optimize production batches.
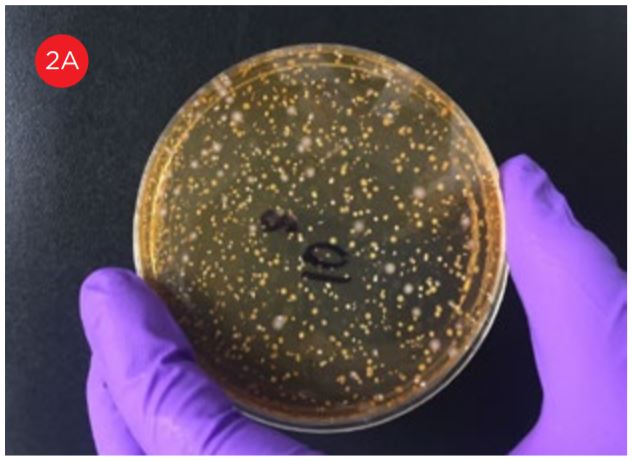 |
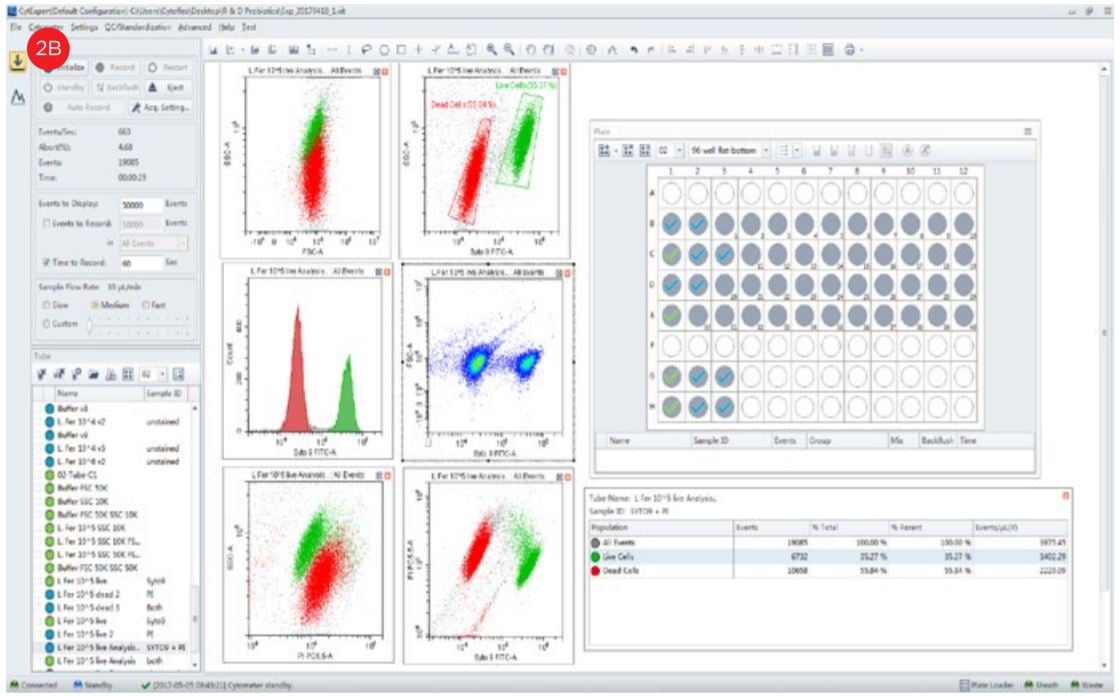
Figure 2. Comparison of the data collection read outs for the Plate Count and Flow Cytometry methods. Panel A is a typical cultured plate from which bacterial colonies are counted. This method requires a technician to accurately discriminate between overlapping or differently sized colonies to obtain counts, typically done in duplicate. Panel B shows the software screen during acquisition using flow cytometry. The instrumentation counts individual bacteria and live versus dead organisms can be differentiated based upon staining characteristics. |
In order to decrease the time from sampling to result, VitaQuest embarked on an initiative to improve the enumeration assay by innovating a non-culture-based approach. Flow cytometry offers a fast, reliable method for counting large numbers of events. Advances in the technology result in the ability to reliably detect smaller particles, making it an attractive technology for process development and quality control in the probiotic industry. In addition, the CytoFLEX Flow Cytometry Platform, through an innovative approach to the fluidic system, has the capability to perform absolute counting without the addition of counting beads to the sample.
Materials
- Bacterial cultures, Lactobacillus fermentum (150 B/g, expected count based upon plate count method) and Lactobacillus rhamnosus (350 B/g, expected count based upon plate count method)
- BD Difco™ Buffered Peptone Water. Catalog Number 218105. Final pH 7.2 ± 0.2. (Prepared according to the manufacturers recommendations and sterilized by autoclaving at 121 °C).
- LIVE/DEAD BacLight Viability and Counting kit for Flow Cytometry by Thermo Fisher Scientific, Catalog Number L-34856. The kit includes two nucleic acid stains, green fluorescent SYTO9 and red fluorescent Propidium Iodide and a suspension of microspheres.
- CytoFLEX Flow Cytometer Blue-Red Violet Series B4-R2-V0, Beckman Coulter, Brea, CA)
Tips for Success
- In order to determine the optimal sample dilution for flow cytometric analysis, prepare a range from 1 x 10⁵ to 1:108.
- The flow cytometer settings will vary depending on the cell size being analyzed and adjustments will be necessary. See protocol and discussion related to optimal settings for Lactobacillus fermentum, rhamnosus and B. longum. It is recommended to try different threshold settings while running the sample to observe the best data resolution at different set points.
- Calibrate the flow rate on the CytoFLEX Flow Cytometer following the directions in the Instructions for Use document. This will ensure that the sample volume is measured correctly to support the absolute counting analysis.
Protocol
- Weight out 1 gm of the product. Dilute in 9 mL of buffered peptone water, followed by serial dilutions.
- Lactobacillus fermentum (optimal assay dilution 1:105)
- Lactobacillus rhamnosus (optimal assay dilution 1:106)
- Aliquot 1 mL of the diluted sample and add the staining reagent:
- Incubate samples in a 45-47 °C water bath for 10-15 minutes.
- 96-well Plate: 2 μL of SYTO9 and 2 μL Propidium Iodide
- Single Tube: 2 μL of SYTO9 and 2 μL Propidium Iodide
- Incubate the samples for 15 minutes in the dark
- Add 250 μL into the sample well or 1 mL if using single tube mode.
- Set up the experiment in the flow cytometer.
- Aliquot 1 mL of the diluted unstained sample to create a control to use for setting the gates based upon forward and side scatter characteristics. Set amplifiers to logarithmic amplification.
- Set the amplification to position the bacterial population in the middle of the graph. Adjust the threshold level and gain settings to minimize electronic noise.
- Acquire the data from the sample and apply the gates from unstained.
- Acquire data from the stained sample and set gates based upon fluorescent staining and calculate population statistics.
- Calculate total cells by factoring the events/μL multiplied by the dilution factor.
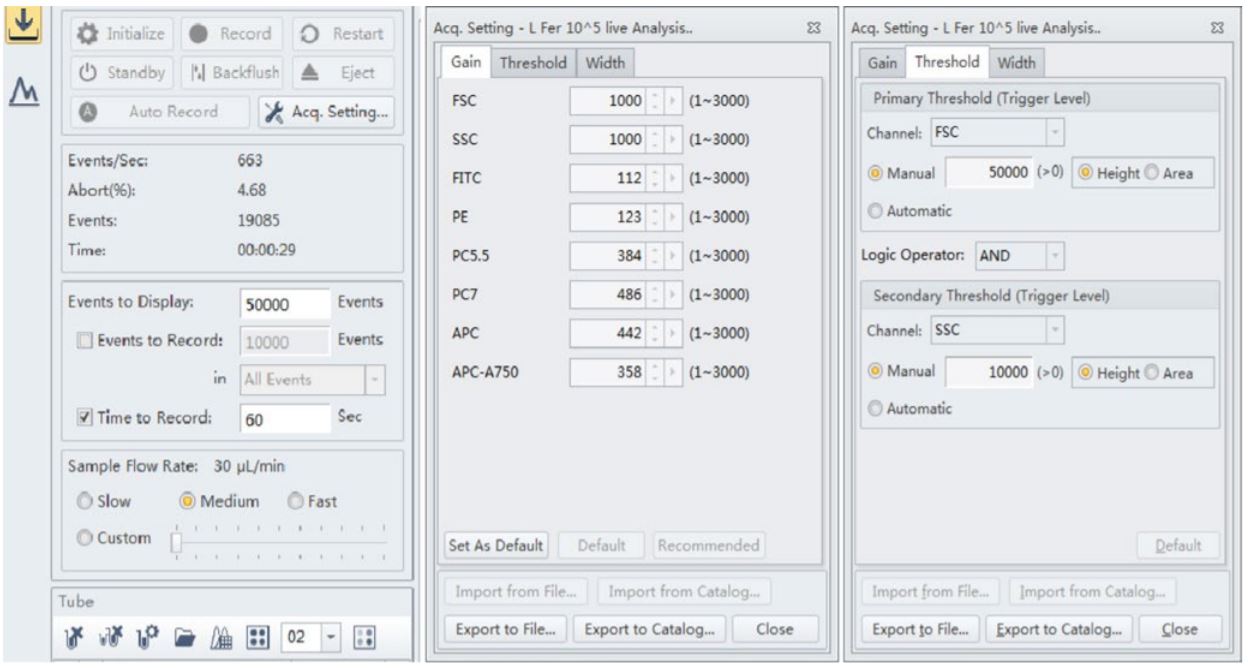
Figure 3. CytoFLEX Instrument and acquisition settings. The best results were observed when the threshold level was set at 50,000 for the forward scatter and 10,000 for the side scatter for these strains of Lactobacillus. The Gain for both forward scatter and side scatter showed good signal when set at 1000 respectively
Results and Discussion
The data acquired in this study represents the analysis of Lactobacillus fermentum serially diluted to a final concentration of 1:105, data acquired of the analysis of Lactobacillus rhamnosus diluted to a final concentration of 1:106 and the data acquired for Bifidum longum, final concentration 1:106. The LIVE/DEAD kit worked effectively staining both viable and non-viable cells. CytoFLEX provided consistent results with different samples analyzed using the same staining kit, settings were modified accordingly for different bacterial strains (data not shown).
Many of the manufactured probiotic supplements at VitaQuest contain different strains of Bifido and Lactobacillus; these bacterial cells are very small in size (0.5-1.3 micrometers by 1.0-10.0 micrometers). For Lactobacillus fermentum and rhamnosus flow cytometric analysis, best results were observed when the threshold level was set at 50,000 for the forward scatter and 10,000 for the side scatter; however these strains were also detected at a threshold level of 5,000 for both side scatter and forward scatter as well. The Gain for both forward scatter and side scatter showed good signal when set at 1000 respectively.
Some events observed outside the gated areas need further analysis, see figure 4.
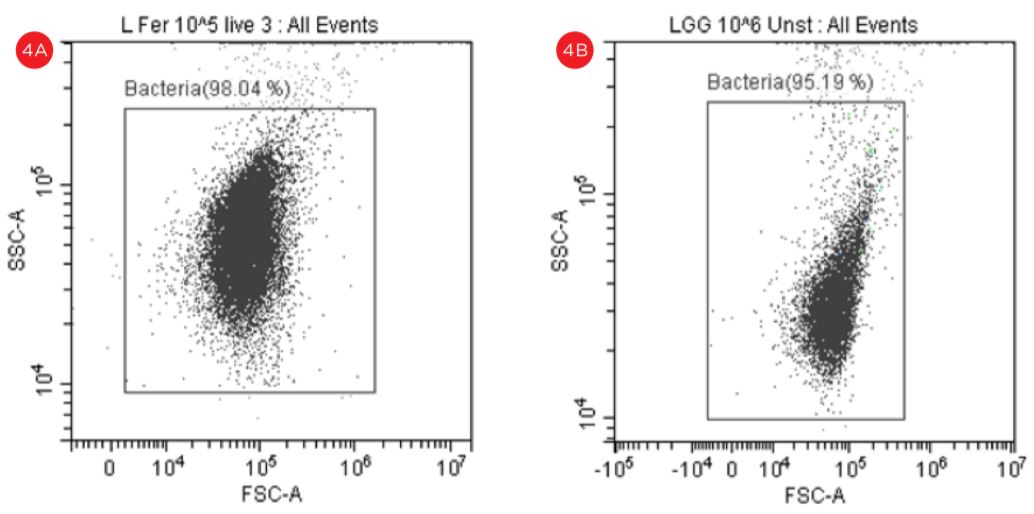
Figure 4. Forward Scatter versus Side Scatter Dot Plot. An unstained suspension of cells were displayed in forward scatter (FSC) vs side scatter (SSC) plot in logarithmic scale and a gate named Bacteria is used to capture the cells of interest. The “bacteria” gate is used to gate the fluorescent plots, panel A, Lactobacillus fermentum, panel B Lactobacillus rhamnosus.
Traditionally, due to its positive pressure, flow cytometers rely on the addition of a known quantity of beads to the sample in order to calculate the volume of sample acquired; with the pressure differential in the sheath versus the sample quantifying the volume is impossible. In contrast the CytoFLEX Flow Cytometer’s fluidics is based upon positive displacement. The volume of sample is a factor of the flow rate and time. The sample uptake rate was calibrated prior to collecting data and by factoring in the final concentration of the sample with the volumetric count of cells/μL(V), the total viable cell count was determined, see Table 1 and 2, Lactobacillus fermentum, and Lactobacillus rhamnosus, respectively.
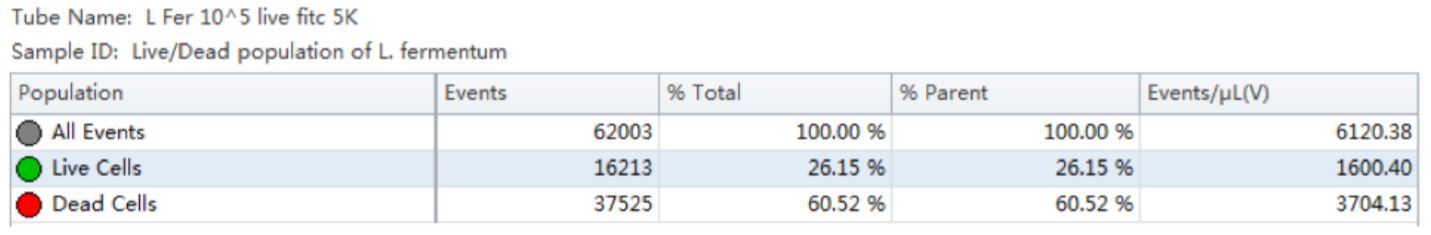
Table 1. Population Statistics. Number of events and percent of total events collected in each gate are calculated for the Lactobacillus fermentum cell population.
Using the traditional Plate Count method, the sample of Lactobacillus fermentum had a known concentration of 150 B/g. Using our analysis by flow cytometry the cell count was determined by factoring the Events/μL (V) (1600.4) times the dilution factor (105). The final number was then multiplied by 1000 to convert the units of μL into mL, resulting in a value of 160 B/g. See Table 1.
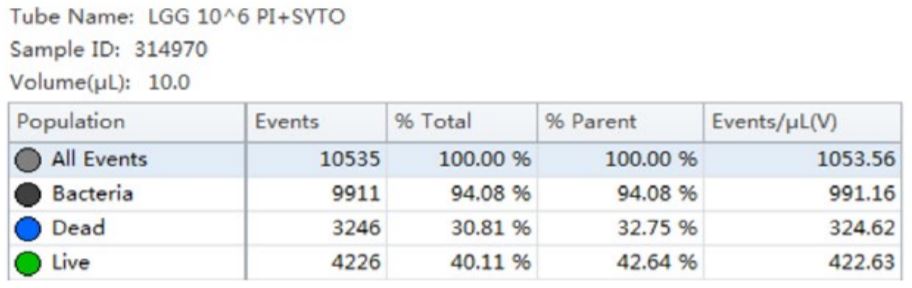
Table 2. Cell Population Statistics. Number of events and percent of total events collected in each gate are calculated for Lactobacillus rhamnosus cell population.
Using the traditional Plate Count method, the sample of Lactobacillus rhamnosus had a known concentration of 350 B/g. Using our analysis by flow cytometry the cell count was determined by factoring the Events/μL (V) (422.63) times the dilution factor (106). The final number was then multiplied by 1000 to convert the units of μL into mL, resulting in a value of 423 B/g. See Table 2.
Bifidobacterium and Lactobacillus are both Gram positive, Lactic Acid (LAB) producing bacteria; and are very small in size (0.5-1.3 micrometers by 1.0-10.0 micrometers). These types of bacteria are the most frequently used in probiotic preparation. Bifido and Lacto bacteria can behave differently when subjected to environmental stress.
Bifidobacteria is known to be more sensitive to environmental conditions than Lactobacillus. Naturally, bacteria are fighting for survival and reproduction; in some cases Lactobacillus may inhibit the ability for Bifidobacterium to form colonies when a blend of both is cultured together. Bifidobacterium may go into a dormant state due to stress induced genes; this means they are still metabolically active but not able to form colonies (VBNC) when using a culture dependent method.
The flow cytometer settings will vary depending on the cell size being analyzed and adjustments will be necessary; during analysis of B. longum, best results were observed when the threshold was set at 5,000 for FSC or FITC and 5,000 for SSC compared to the threshold settings used during the analysis of Lactobacillus.
Despite the fact that Lactobacillus is also detected at the threshold level of 5000, the Bifido bacteria did not displayed a good separation when the threshold level was set at 50,000, see Figure 5.
Figure 5. Gating Strategy for Live/Dead B. longum Analysis. The SYTO9 staining is shown in a PC5.5 vs SYTO9-FITC dot plot, threshold set at 5,000 (panel A). The events in red are dead and the events in green are viable. The PI staining is shown in a PC5.5 vs FITC dot plot with the threshold set at 50,000 (panel B). Populations of “Live” and Dead” B. longum cells are best displayed when settings for the threshold are set at 5,000 (panel A).
Using the traditional Plate Count method, the sample of B. longum had a known concentration of 100 B/g. Using the analysis by flow cytometry the cell count was calculated, 150B/g.
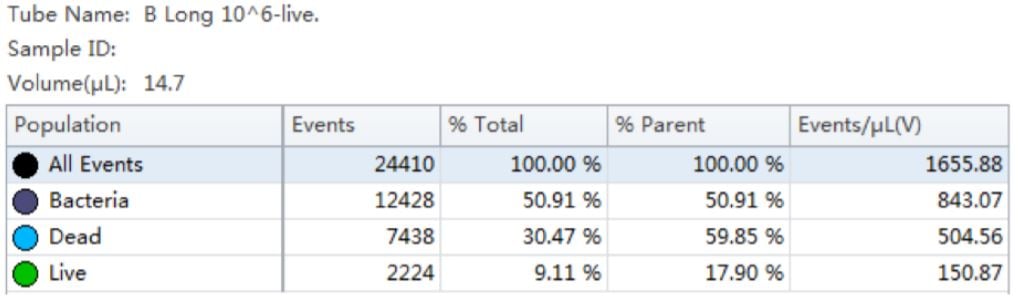
Table 3. Cell Population Statistics. Number of events and percent of total events collected in each gate are calculated for the B. longum cell population.
The use of Flow Cytometry for cell count has advantage over the traditional pour-plate method because it provides count for viable cells but also for VBNC cells, see Figures 6 and 7.
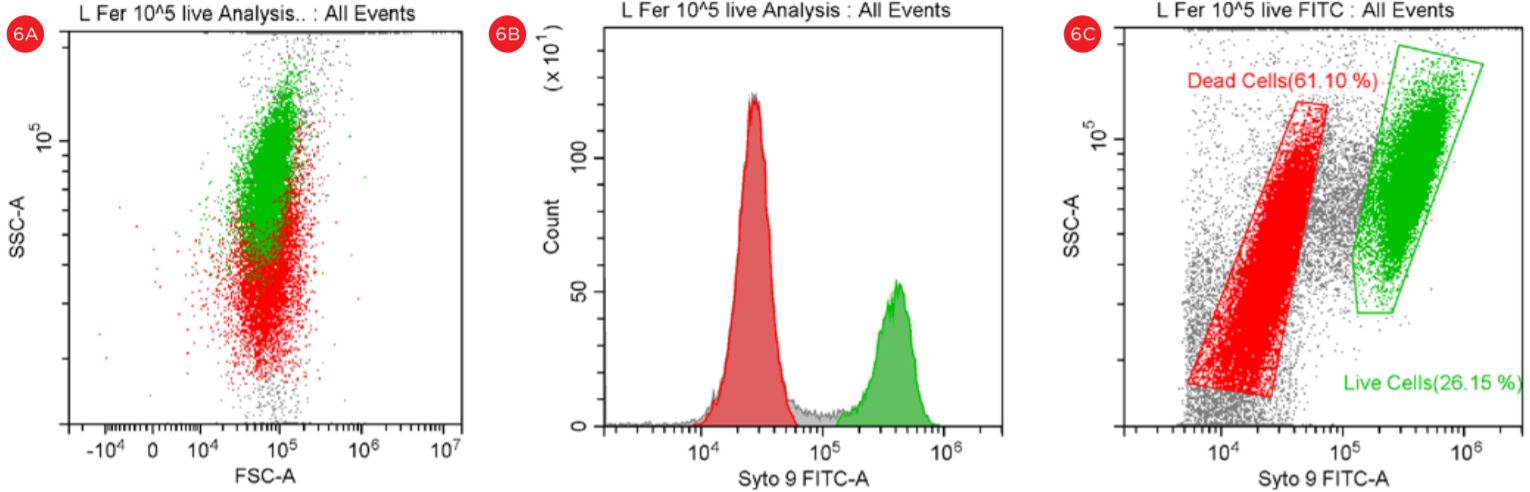
Figure 6. Gating Strategy for Live/Dead L. fermentum Analysis. Bacterial population stained with PI and SYTO9 is shown in a SSC vs FSC dot plot (panel A). The number of events collected in each population is shown in a Count vs FITC histogram (panel B). The events in red are dead and the events in green are viable. “Dead” and “Live” gates created to analyze the viable cell count population (panel C).
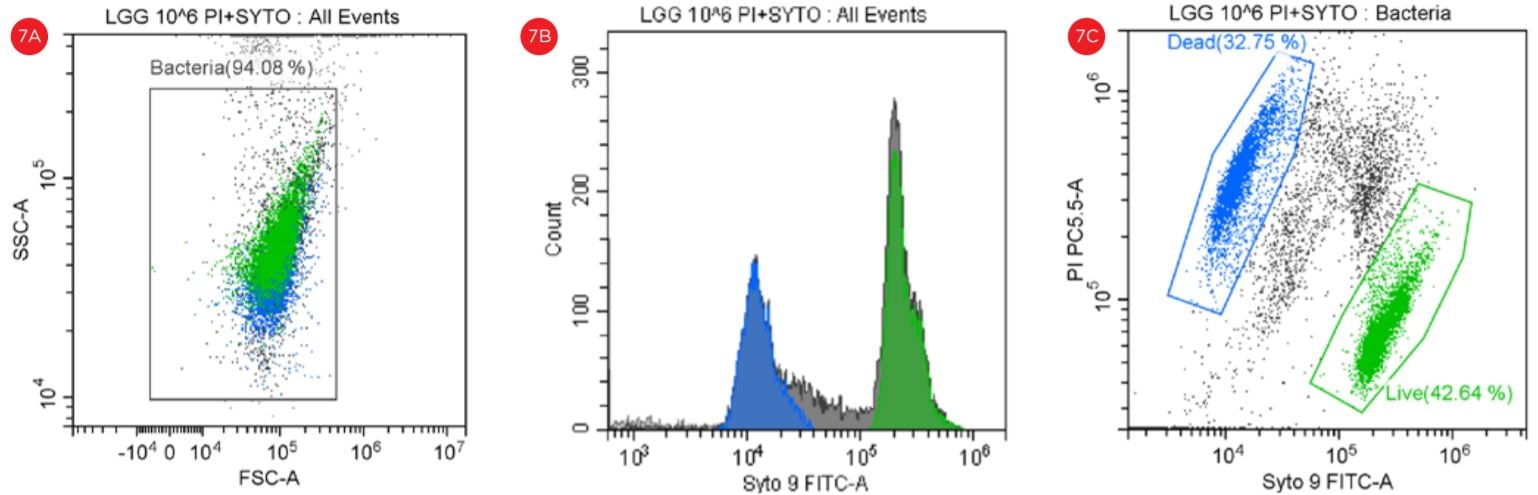
Figure 7. Gating Strategy for Live/Dead L. rhamnosus Analysis. The SYTO9 and PI staining is shown in a SSC vs FSC dot plot (panel A). A histogram shows the peaks representing the data collection in the FITC channel (panel B). The events in blue are non-viable and the events in green are viable. The PI staining is shown in a PI-PC5.5 vs SYTO9-FITC dot plot (panel C).
Conclusion
Flow Cytometry is a viable option for a non-culture based method for enumerating cells for probiotics manufacturers. Using the CytoFLEX flow cytometer with its ability to resolve small particles down to 200 nm, we were able to reliably count bacteria as small as 0.5 μm.
The results obtained in this study indicate that flow Cytometry is applicable for probiotic cell count assay; both dyes, SYTO9 and PI were able to identify viable and non-viable cells, providing the analyst additional information on the status of the cultures.
The cell counts obtained with flow cytometry are in good agreement with the plate count method, for Lactobacillus fermentum, Lactobacillus rhamnosus and Bifidum longum. With the flow cytometry method we anticipate a higher viable cell count than that observed with a Plate Count method. Flow Cytometry counts are typically higher due to the detection of viable, but non-culturable organisms.
The workflow improvements with time to result as low as 2 hours versus 3 days for the traditional method, as well as the additional information provided on viable versus non-viable cells will allow manufacturers to save time and labor as well as provide for new capabilities for in line process testing which can be used to optimize production processes.
References
- The history of probiotics: the untold story. Benef Microbes. 2015; BM2014.0103. Ozen M, Dinleyici EC. Faculty of Medicine, Department of Pediatrics, Acibadem University, Halkali, Istanbul. Faculty of Medicine, Department of Pediatrics, Eskisehir Osmangazi University, 26480 Eskisehir, Turkey.
- Enumeration of probiotic strains: Review of culture-dependent and alternative techniques to quantify viable bacteria. Catherine Davis, Medical Microbiology & Immunology, School of Medicine and Department of Biology, College of Arts & Sciences, Creighton University. 2014. Published by Elsevier B.V. This is an open access article under the CC BY license.
- Development of a Flow Cytometric Method to Analyze Subpopulations of Bacteria in Probiotic Products and Dairy Starters. Christine J. Bunthof and Tjakko Abee. Laboratory of Food Microbiology, Department of Agrotechnology and Food Sciences, Wageningen University, 6700 EV Wageningen, The Netherlands, Received 2 October 2001/Accepted 13 March 2002.
